


The inversion of the yield curve in the US is a hot topic with calls from White House adviser Larry Kudlow over the weekend for the Federal Reserve to cut the official rates by half a percent immediately.
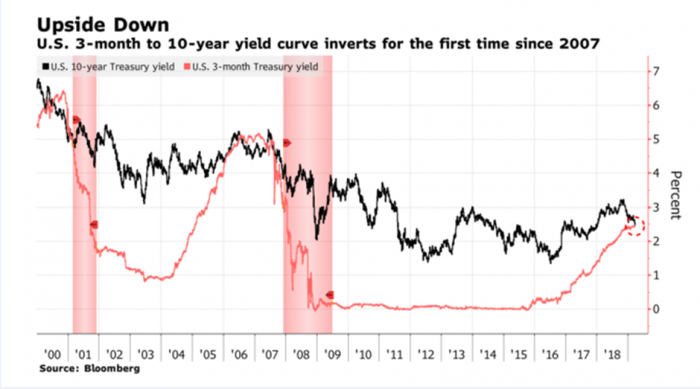
European, US and the Australian bond markets are showing an ominous red flag with their inverted yield curves. The chart shows the relationship between the yield of 3-month debt compared to the yield of 10-year debt. An inverted yield curve shows near term interest rates are higher than those in the future, indicating the market assume rates will need to be cut in response to weaker economic conditions. Bond yields started to fall further after the release of weak economic data from Europe. The European Purchasing Managers Index (PMI) for manufacturing falling to 47.6 and Germany, the manufacturing powerhouse of Europe, falling to 44.7 below expectation of 48. This economic data combined with concerns articulated by FED Chair Jerome Powell noting a weakening of the European and Chinese economies led to many investors to reassess their view of economic growth causing bond yields to fall.
The Purchasing Managers Index is compiled monthly by the Institute of Supply Management and is sent to more than 400 companies. The survey is based on new orders, inventory levels, production, supplier deliveries, prices and employment. It provides a reasonably good health check on current business conditions. A number above 50 represents an expansion in activity and under 50 a contraction. The sudden change in conditions below 50 in Germany indicates a sudden deceleration in activity which is notable and indicative of a sudden slowdown in economic demand.
There are several other data points which add further weight to the theory of a global slowdown in economic activity. Korean shipments of semiconductor sales have fallen by 25% in February on a year on year comparison. Semiconductors are a key input into most electrical equipment and lower demand indicates a reduction in production levels as companies respond to falling anticipated demand for their products.
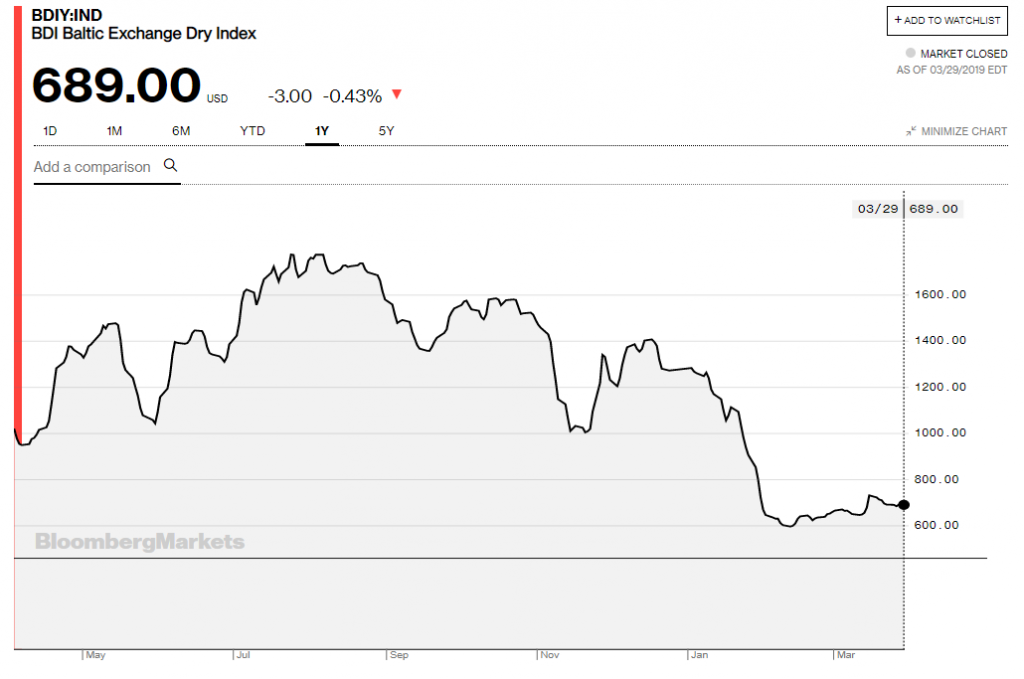
The Baltic Dry Index, (BDI) is issued daily by the Baltic Exchange, the index is a composite of the average rate to charter and transport goods using Capesize, Panamax and Supermax ships. It provides a reasonable proxy for economic activity as the cost of shipping falls as demand for its services fall, while in period of high economic activity the cost increases. Adding or removing ships from the global pool takes time so a fall in the BDI is a red flag indicating softer economic demand for goods within the global.
Source: Bloomberg
As we head towards a period of harsher economic conditions and slowing economic demand many are asking whether this is because of the ongoing US/China trade war. With US and China negotiating a trade deal, one could argue the equity market is pricing in a favourable deal and a turnaround in global demand, while the bond market is looking too far into the rear mirror rather than anticipating a change in conditions. Increased tariffs disrupt supply routes causing companies to change business practices and offset higher indirect cost with higher pricing, which invariably impacts demand. Any trade deal will take time to play out and momentum remains on the downside as companies revise down their growth outlook. Since 2008 the global economy has been on a road of economic recovery with a decade of year-on-year global growth with the US and Europe moving from quantitative easing to monetary tightening policies. Ten years of economic growth is a long period of expansion and we view the economic cycle to be in its mature stage and a cyclical contraction is now beginning to play out. We are not convinced a trade deal between the US and China will materially offset a slowdown in economic activity and favour the view of the bond market.
ASR Wealth Advisers has created a model income portfolio (General Advice Only) which is focused on protecting capital and looking for yield in companies which we expect can deliver consistent cash flow through the economic cycle. With bond yields falling and many Australians moving into their retirement phase it is becoming increasingly more difficult to obtain a reasonable income to offset the increased cost of living. Gas, electricity, health care and insurance costs continue to spiral up above the rate of inflation adding pressure to the real income for pensioners as the returns from term deposit are unable to offset the rising cost of living.
Our income portfolio has a market beta of less than one, this means the portfolio goes up less than the market when it rises but goes down less than the market when it falls. We have a large percentage of the portfolio invested in utilities and utility-type businesses that offer consistent cashflows. Sustainability of income is a key attribute we seek and are willing to sacrifice yield at the expense of ensuring we own what we consider are low risk sustainable cashflow businesses. We seek out monopoly type assets which are regulated or semi regulated and pay distributions through the economic cycle. Investing in an equity portfolio incurs equity risk, meaning the portfolio will fall in value if there is a large market sell off. We seek to reduce this risk by looking through a business to seek out earnings streams which we view as defensive in nature and demonstrate low levels of cyclicality of earnings. As witnessed in the global financial crisis, the debt market can become disorderly causing utility and real estate companies to issue equity as debt maturities became increasingly difficult to roll over. We assess the debt profile of each of our companies to look at near term debt repayments and assess the cashflows to refinance these liabilities when they mature.
ASR Wealth Advisers will be presenting at the ASA conference in May and discussing the topic of dividends vs total return. Forecast dividends can provide a false sense of security, companies paying a large percentage of their earnings out in dividends will be forced to reduce these payments if earnings contract faster than management expected. Telstra and AMP offer recent examples of falling dividends in response to a contraction in earnings. In compiling our income portfolio, the analyst team at ASR Wealth spend the required time to look through each business to understand the industry a company operates in and form a view on the competitive advantage of the company to deliver a return on capital above its cost of capital. We dig through the financials to ensure we reduce the investment risk and ensure when we add a stock to our model portfolio we have a reasonable level of confidence it will deliver the required consistency of cashflow through the economic cycle and offer that much needed income for our client.
Disclaimer:
This article has been prepared by the Australian Stock Report Pty Ltd (AFSL: 301 682. ABN: 94 106 863 978)
(“ASR”). ASR is part of Amalgamated Australian Investment Group Limited (AAIG) (ABN: 81 140 208 288 Level 13, 130 Pitt Street, Sydney NSW 2000).
This article is provided for informational purpose only and does not purport to contain all matters relevant to any particular investment or financial instrument. Any market commentary in this communication is not intended to constitute “research” as defined by applicable regulations. Whilst information published on or accessed via this website is believed to be reliable, as far as permitted by law, we make no representations as to its ongoing availability, accuracy or completeness. Any quotes or prices used herein are current at the time of preparation. This document and its contents are proprietary information and products of our firm and may not be reproduced or otherwise disseminated in whole or in part without our written consent unless required to by judicial or administrative proceeding. The ultimate decision to proceed with any transaction rests solely with you. We are not acting as your advisor in relation to any information contained herein. Any projections are estimates only and may not be realised in the future.
ASR has no position in any of the stocks mentioned.


